http://www.informationisbeautiful.net/visualizations/radiation-dosage-chart/
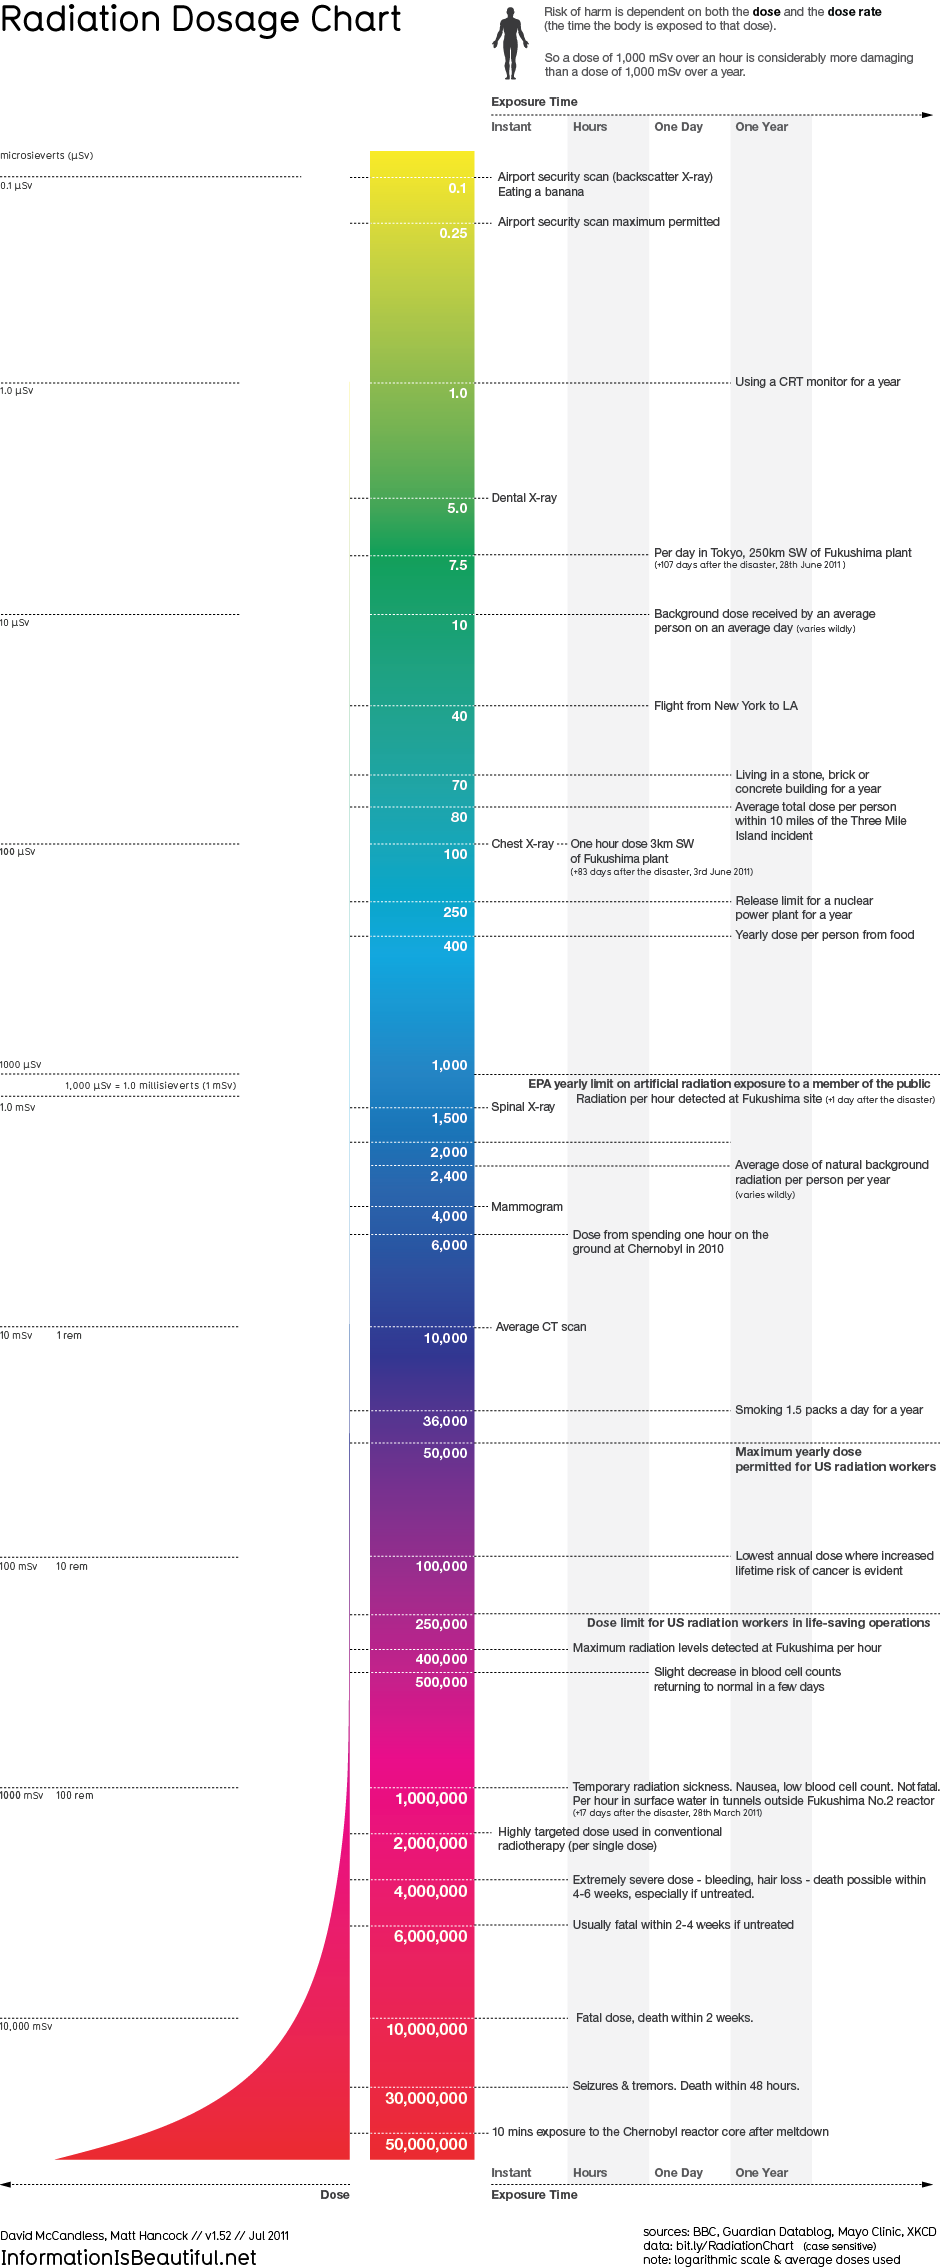
The more time I spend looking at the infographic above, the more it does not make sense. This radiation dosage chart starts off by giving radiation levels and what people can do or eat to receive those levels of radiation. By the time you get to the bottom of the chart, however, the information on the right switches to how fast that specific dose of radiation will kill you. It doesn’t tell you what you could be doing or where you would have to be to receive that amount of radiation. The infographic is really not helpful in any way to providing people with useful information.
The infographic starts off using cool colors to represent the small amounts of radiation, and then moves to warm colors to emphasize the intensity of large amounts of radiation. I believe the designer did keep restraint and reduction in mind when designing this infographic, because it includes simple text, a simple shape and nothing is really over the top or unnecessary. I just think in general this infographic doesn’t make sense so overall it is very ineffective. Once the information was corrected, I think this would have been better represented as a chart or graph.
I really like infographics when they are done correctly. I think they can be very interesting and sometimes it is neat to see information represented visually instead of just looking at a chart or graph. I believe with the right information, right visuals and a good design, infographics can be effective and useful.


