With the number of websites that are currently out there, it is important for companies and businesses to have well designed websites if they want customers to come back. A good website is one that is clean, has personality, stands out among its competitors, is extremely effective and is well thought out and usable.
A website might look nice, but if it doesn't contain the information people are looking for, and it does not come up when key words are typed in search engines, the site is useless. A few years ago, a friend of mine had a website built for his company, and his site looked great. The only problem was, the site was built as either a .jpeg or pdf (I can't remember which), so it never came up in a search.
Sites designed with the user in mind are ones that work best. The designer and content manager needs to think like a user and ask themselves, "What am I looking for and where would I look?" everytime they place content on a page.
Below is an image of the home page of the company Wake Interactive's website. I believe this website, http://www.wakeinteractive.com/, is very well designed and easy to use. These are both good things since the company is a creative web design company that builds websites for clients. I really like everything about this website and I think it hits all of the "good website" marks listed above. If I were looking for a company to build my website, I would pick this company based on their own site.
Below is an image of
I've decided to add my "awareness of design" thoughts to my blog I did for a previous class. Part of my job as a communications specialist is design work and the more I do it, the more aware I become of good and bad design.
Wednesday, June 29, 2011
Thursday, June 23, 2011
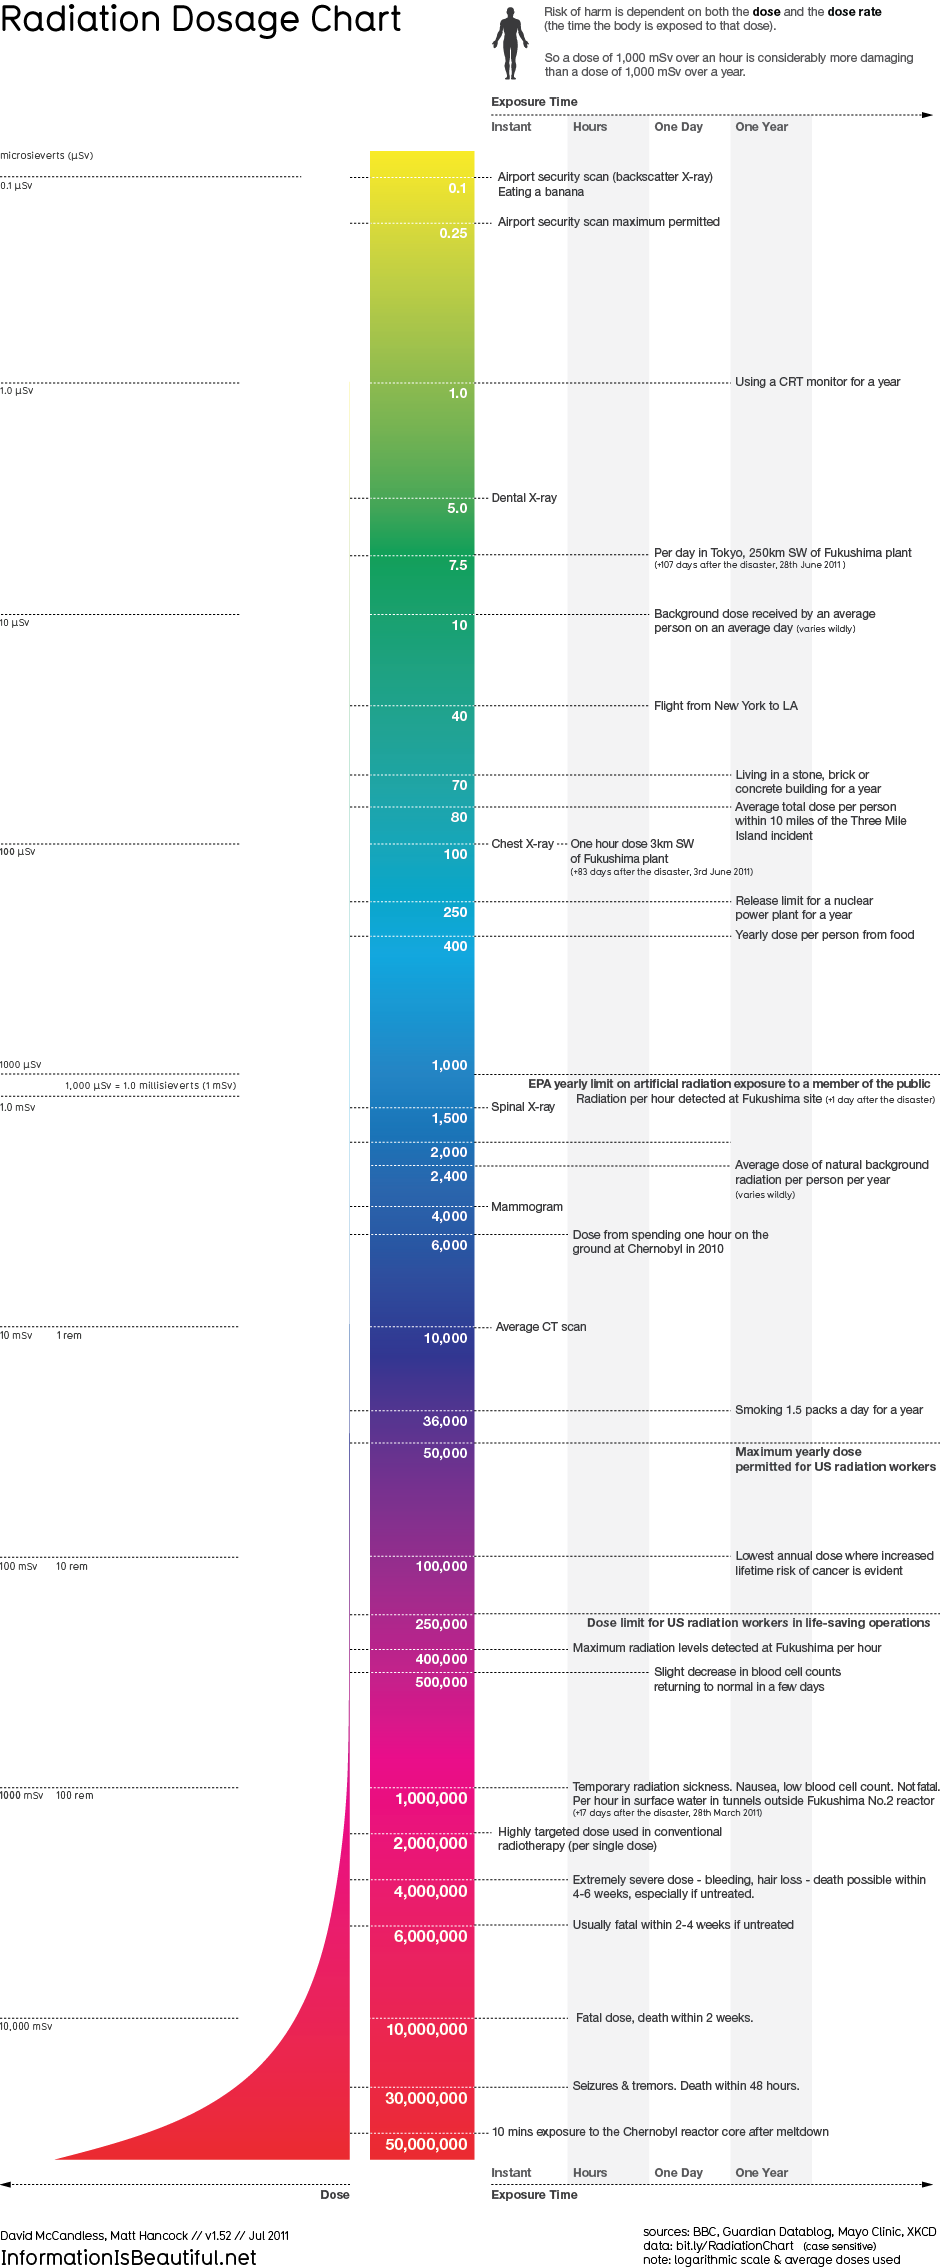
Infographics gone bad.
Link to infographic:
http://www.informationisbeautiful.net/visualizations/radiation-dosage-chart/

http://www.informationisbeautiful.net/visualizations/radiation-dosage-chart/

The more time I spend looking at the infographic above, the more it does not make sense. This radiation dosage chart starts off by giving radiation levels and what people can do or eat to receive those levels of radiation. By the time you get to the bottom of the chart, however, the information on the right switches to how fast that specific dose of radiation will kill you. It doesn’t tell you what you could be doing or where you would have to be to receive that amount of radiation. The infographic is really not helpful in any way to providing people with useful information.
The infographic starts off using cool colors to represent the small amounts of radiation, and then moves to warm colors to emphasize the intensity of large amounts of radiation. I believe the designer did keep restraint and reduction in mind when designing this infographic, because it includes simple text, a simple shape and nothing is really over the top or unnecessary. I just think in general this infographic doesn’t make sense so overall it is very ineffective. Once the information was corrected, I think this would have been better represented as a chart or graph.
I really like infographics when they are done correctly. I think they can be very interesting and sometimes it is neat to see information represented visually instead of just looking at a chart or graph. I believe with the right information, right visuals and a good design, infographics can be effective and useful.
Wednesday, June 15, 2011
"Good" Girl, "Bad" Design
I think a lot went wrong with the design of this poster. Although the movie wasn’t that great to begin with, I think they lost their opportunity to market it correctly by designing a poster that has so much copy on it.
Jennifer Aniston is very well known and liked by so many people – I feel that they should have picked one or two main photos of her and used them on a majority the poster. I don’t think the reviews at the top add a lot to the poster – I think they take up too much room and personally, I don’t know what a movie with “range and depth” and “winning delicacy” really means. If I were designing the poster, I would have kept the one review that says “Sly, comic and touching” and then used a photo of Jennifer as the focal point.
I believe the photos break up the text and readers’ eyes don’t know where to look first. I know that movie posters must have all of the credit information that is at the bottom of this poster, but overall I believe this poster would have been more effective with less text. I do like the sans serif font they chose because it gives the poster a soft look and is a good font to represent “a good girl.” Although the cool colors match Jennifer’s shirt in the photo, I am surprised they chose blues because usually warmer colors such as red or pink are associated with females. Maybe since because in the movie it is ironic that she is called “a good girl” they chose blue to play on that? I think a lot can be done with a movie poster to make the film look good, and I believe the designer was off the mark with this one.
Thursday, June 9, 2011
Tiger Woods Accenture Print Ad
I have to say I really like this ad for Accenture that features Tiger Woods looking for his golf ball in very tall grass. I like how they relate the photo to economic “realities” and how they have the quote “It’s not a setback. It’s a test.” stand out amongst the other text. As suggested by Reynolds, text can set a tone for an ad and I think their choice of a sans serif font was a good one because it gives the ad a relaxed feel. “A large, bold version of a classic sans serif may suggest power, assertiveness, or confidence, whereas the same type in a smaller and lighter version will be more subtle and suggest a quieter confidence, humility, or calm” (Reynolds, 2010, p 48).
One thing Reynolds also suggests is adding a transparent box or screen between text and an image with little empty space to increase readability. I think that this is something that could have been done in this ad, but when printed, I am not sure how hard the text is to read. I think the colors in the photo used in this ad combine warm and cool colors to catch readers’ attention. “Artists use warm and cool colors to create depth and volume in paintings, and we can do the same by observing the relationship between warm and cool colors in a design” (Reynolds, 2010, p 81). I think the yellowish grass combined with the green grass in the background gives the ad a cool, yet dimensional look that helps readers understand that the company Accenture can help them with any business needs they have – Accenture has everything under control. I do think the ad is a little bit wordy and I wonder how many readers actually read all of the ad copy?
I believe this ad was run a few years ago, which was when Tiger Woods had everything in control in his life. Everything has been turned upside down for him now, and Accenture has ended their six-year sponsorship of him so it makes the ad that much more interesting!
References:
Reynolds, Gary . Presentation Zen Design: Simple Design Principles and Techniques to Enhance Your Presentations. Berkeley , CA : New Riders, 2010.
Ad:
http://www.zimbio.com/pictures/AOSqiYx2mtP/Accenture+Drops+Tiger+Woods+Advertising+Campaigns
Friday, June 3, 2011
Billboard Design
I think one of the most difficult advertising mediums to design for is billboards. You want to get an important message out to consumers, but your space is limited and people only see them for seconds at a time. The “less is more” rule definitely applies to billboards, and unfortunately in the Utica area, most designers don’t follow this rule.
The first example is my idea of a bad billboard design. There are almost 30 words, a phone number, website, etc. and viewers just don’t know where to look first. The colors, along with the capitalized font and the crying child really make for a stressful design, and it is not a billboard that I would even try to read or understand.
Our Communications and Marketing Department at the hospital works hard to try and make our billboards stand out from others in our area. We try to limit our billboards to seven words or less and below is an example of a billboard we did for our PET/CT scanner. After we ran a media campaign for the scanner, we have performed 30% more scans consistently each month. Although I don’t think this billboard is the best design in the world, I do think it sets our hospital apart from other advertisements that are out in the community. The colors are vibrant, the text is designed in a way that is easy to read and understand, and it is simple.
Subscribe to:
Posts (Atom)